
Crude Oil Technical Analysis: Is USOIL Preparing for a Major Bearish Reversal?
Crude Oil Technical Analysis: Is USOIL Preparing for a Major Bearish Reversal?
Crude oil remains one of the most actively traded commodities in the world. Traders across global markets constantly monitor price movements, economic developments, and geopolitical events to determine the next direction of oil prices.
Recent price action suggests that crude oil (USOIL) may be preparing for a significant bearish reversal. Technical indicators, trendline breaks, and price gaps are pointing toward potential downside targets that traders are closely watching.
In this analysis, we will break down the technical structure of crude oil, examine the key levels that matter, and explore a potential trade setup based on current market conditions.
Crude Oil Technical Analysis: Is USOIL Preparing for a Major Bearish Reversal?
Understanding the Importance of Crude Oil in Global Markets
Crude oil is one of the most influential commodities in the global economy. Changes in oil prices can impact:
- Inflation rates
- Currency markets
- Global stock markets
- Transportation and manufacturing costs
Because of its economic importance, traders use advanced charting tools such as TradingView to monitor crude oil price movements and identify trading opportunities.
Oil prices are also heavily influenced by geopolitical decisions from organizations such as OPEC, which regulates production levels among major oil-producing countries.
Current Market Structure: Signs of a Trend Reversal
For several months, crude oil maintained a strong uptrend, forming higher highs and higher lows on the price chart.
However, recent price action indicates that the bullish structure may be weakening.
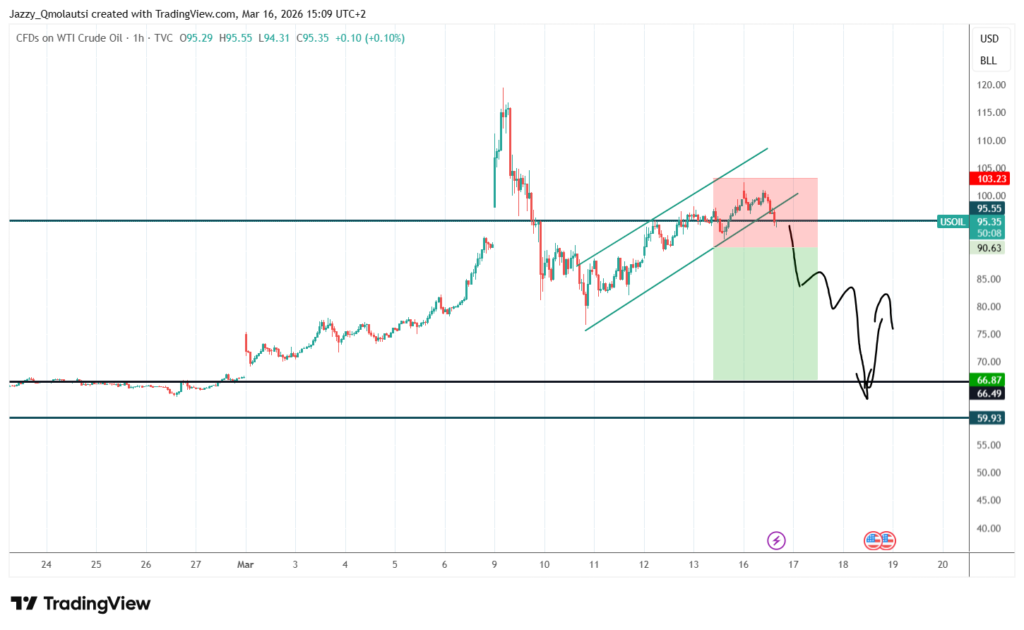
The key event signaling this shift was the break of the uptrend around the $95.55 level.
Breaking a trendline is often the first sign that market sentiment may be changing. When price breaks below a long-term support trendline, it can trigger:
- Increased selling pressure
- Stop-loss orders from buyers
- Momentum selling from short traders
These factors can accelerate downward price movement.
Key Technical Level: $95.55 Trendline Break
The $95.55 level acted as a major technical support during the uptrend.
Once this support level was broken, the market confirmed that buyers were losing control.
When such structural breaks occur, professional traders typically look for:
- Retests of the broken support (now resistance)
- Continuation patterns to the downside
- Price targets based on previous market gaps or support zones
This is exactly what the current crude oil chart is beginning to show.

Gap Analysis: Why Price May Move Toward $66
One of the most interesting elements in the current crude oil structure is the presence of price gaps.
Price gaps occur when an asset opens significantly higher or lower than the previous trading session without trading in between those levels.
In many cases, markets tend to return to fill these gaps before establishing new trends.
First Gap: Already Filled
The first gap in the crude oil chart has already been closed. This confirms that the market is following the typical behavior of revisiting previous imbalance zones.
Once the first gap was filled, sellers began pushing the market lower again.
Second Gap Target: $66.49
The next major gap sits around $66.49, which represents a potential long-term downside target.
Markets often gravitate toward these levels because they represent areas where liquidity previously existed.
If bearish momentum continues, crude oil may attempt to fill this second gap in the coming months.

Proposed Trade Setup
Based on the current market structure and technical signals, the following trade setup becomes interesting for traders monitoring crude oil.
Sell Entry: $90.63
Take Profit: $66.87
Stop Loss: $103.23
This setup reflects a bearish bias following the break of the long-term uptrend.
The stop loss is positioned above the previous swing high to protect against false breakouts, while the take profit aligns with the gap-fill target.

Risk-to-Reward Analysis
Professional traders always analyze the risk-to-reward ratio before entering a trade.
In this setup:
- Risk = approximately $12.60
- Reward = approximately $23.76
This results in a risk-to-reward ratio of nearly 1:2, which many traders consider favorable.
Maintaining a strong risk-to-reward ratio is one of the key principles of professional trading.
Technical Indicators Supporting the Bearish Outlook
Technical indicators also provide additional confirmation for the bearish scenario.
Moving Averages
Crude oil has started trading below short-term moving averages, which often signals weakening bullish momentum.
If price continues to remain below these averages, the downtrend may strengthen.
Relative Strength Index (RSI)
The RSI indicator suggests that bearish momentum is increasing. While the market has not yet reached extreme oversold conditions, the downward slope indicates growing selling pressure.
Volume Analysis
Increasing selling volume during recent price drops indicates that institutional traders may be participating in the sell-off.
High volume during declines usually confirms the strength of a bearish trend.
Fundamental Factors That Could Influence Oil Prices: The Iran War
Geopolitical conflicts are among the most powerful fundamental drivers of oil prices. One of the most important geopolitical risks currently affecting energy markets is the ongoing conflict involving Iran.
Because Iran plays a major role in global energy production and sits near critical shipping routes, any military escalation in the region can significantly impact crude oil supply and prices.
Iran’s Role in Global Oil Supply
Iran is one of the major oil producers within OPEC, producing roughly 3.3 million barrels of crude oil per day. Disruptions to Iranian production or exports can tighten global supply and push oil prices higher.
If Iranian exports were removed from global markets for an extended period, analysts estimate oil prices could climb significantly as global supply becomes constrained.
While technical analysis provides valuable insights, crude oil is also influenced by fundamental factors.
Some of the most important drivers include:
Global Economic Growth
Economic slowdowns reduce demand for energy, which can push oil prices lower.
Supply Decisions
Organizations such as OPEC regularly adjust production levels, which can impact oil supply.
Geopolitical Events
Conflicts, sanctions, and trade tensions can disrupt oil supply chains and cause price volatility.
Currency Movements
Oil is priced in US dollars, meaning fluctuations in the dollar can influence crude oil prices.
Traders often combine these macro factors with technical analysis to form a more complete market outlook.
Why Technical Analysis Matters for Oil Traders
Technical analysis helps traders interpret price action and identify high-probability trading opportunities.
Platforms such as TradingView allow traders to:
- Draw trendlines
- Identify support and resistance levels
- Analyze volume and indicators
- Monitor market sentiment
These tools help traders build structured trading strategies rather than relying on emotional decisions.
Trading Psychology During Market Reversals
Market reversals often create emotional trading conditions.
When a strong uptrend suddenly breaks, many traders experience:
- Panic selling
- Fear of missing out on short trades
- Overtrading
Professional traders avoid these mistakes by following clear strategies and risk management rules.
Maintaining discipline is essential when trading volatile commodities like crude oil.
Risk Management for Crude Oil Trading
Crude oil is known for its high volatility, which means proper risk management is critical.
Key risk management strategies include:
Use Stop-Loss Orders
Always protect trades with stop-loss orders to limit potential losses.
Manage Position Size
Never risk too much capital on a single trade.
Avoid Overleveraging
Leverage can amplify profits, but it also increases the risk of large losses.
Monitor Market News
Major economic announcements or geopolitical events can trigger sudden price movements.
Potential Scenarios for Crude Oil
While the bearish scenario currently appears strong, traders should always consider alternative possibilities.
Bearish Scenario
If crude oil remains below the broken trendline and continues forming lower highs, the market may gradually move toward the $66 gap zone.
Neutral Scenario
Oil could also enter a period of consolidation before choosing a new direction.
Bullish Scenario
If price unexpectedly breaks above $103, the bearish setup would be invalidated and buyers could regain control.

Crude oil is showing several technical signals that suggest a potential long-term bearish reversal.
The break of the uptrend around $95.55, combined with the presence of unfilled price gaps and increasing selling pressure, indicates that the market could be preparing for a deeper correction.
The proposed trade setup — selling around $90.63 with a target near $66.87 — aligns with the technical structure currently visible on the chart.
However, traders should always combine technical analysis with proper risk management and remain aware of macroeconomic factors that could influence oil prices.
Educational platforms such as InvestInSA aim to help traders understand these market dynamics and develop disciplined trading strategies.
By studying price action, market structure, and global economic trends, traders can better position themselves to navigate volatile markets like crude oil.
Frequently Asked Questions (FAQ)
1. What is crude oil technical analysis?
Crude oil technical analysis is the process of studying price charts, indicators, and market patterns to predict future price movements. Traders use tools such as TradingView to analyze trends, support and resistance levels, and momentum indicators when trading USOIL.
2. Why is the $95.55 level important for crude oil?
The $95.55 level acted as a major support during the previous uptrend. Once this level was broken, it signaled that bullish momentum was weakening and sellers were gaining control of the market.
3. What does a trendline break mean in trading?
A trendline break usually indicates a potential change in market direction. When an uptrend line is broken to the downside, it often suggests that the market may be entering a bearish phase or correction.
4. What are price gaps in the oil market?
Price gaps occur when an asset opens significantly higher or lower than its previous trading price without trading in between those levels. In many cases, markets eventually move back to fill these gaps as part of normal price behavior.
5. Why is the $66 level important for crude oil?
The $66.49 area represents a major unfilled gap on the chart. Markets often revisit these imbalance zones, which is why many traders consider this level a potential downside target.
6. How does geopolitics affect crude oil prices?
Geopolitical events such as wars, sanctions, and supply disruptions can significantly affect oil prices. Countries like Iran play an important role in global oil supply through organizations such as Organization of the Petroleum Exporting Countries.
7. Why do traders monitor OPEC decisions?
Production decisions made by Organization of the Petroleum Exporting Countries can influence global oil supply. If OPEC reduces production, oil prices often rise due to reduced supply in the market.
8. What indicators are commonly used when trading crude oil?
Some of the most common indicators used by traders include:
- Moving Averages
- Relative Strength Index (RSI)
- Volume Analysis
- Support and Resistance Levels
- Trendlines
These indicators help traders confirm trends and identify potential entry or exit points.
9. Is crude oil a volatile market?
Yes, crude oil is considered one of the most volatile commodities in financial markets. Prices can change rapidly due to geopolitical events, economic data, and supply-demand imbalances.
10. Where can beginners learn crude oil trading?
Beginners can learn crude oil trading through educational platforms such as InvestInSA and charting tools like TradingView, which provide analysis tools, trading ideas, and market insight